Statistics for your homeschool
Your child investigates where data came from, chooses a method, and explains what a result can and cannot support.
A lesson built around your child
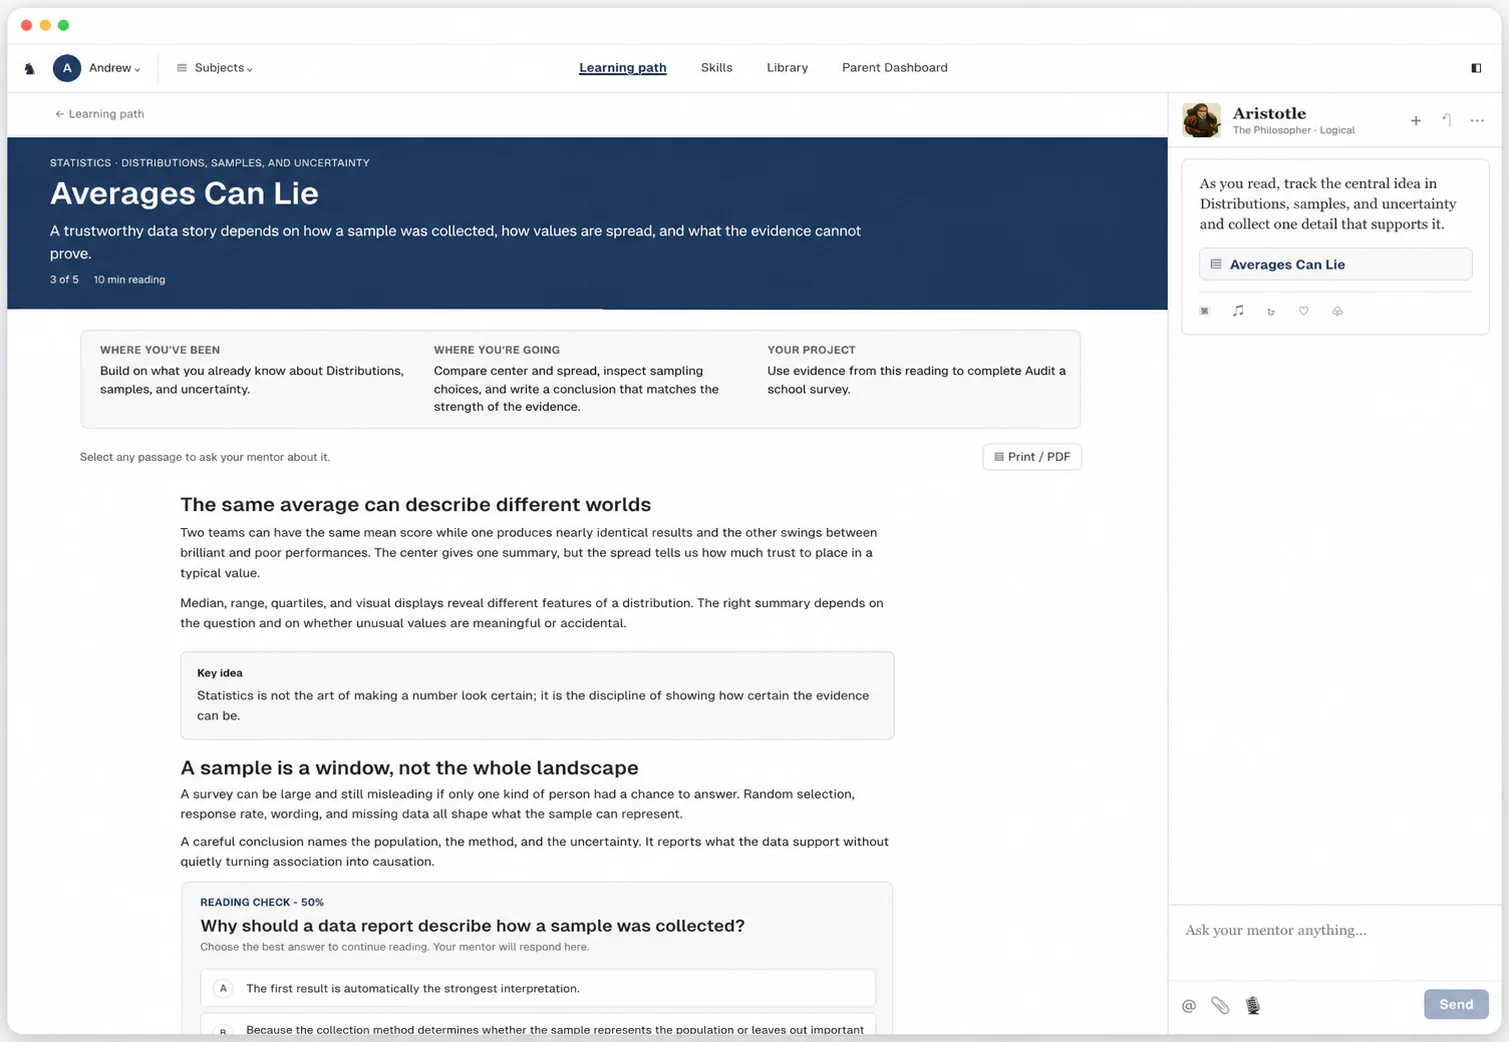
A trustworthy data story depends on how a sample was collected, how values are spread, and what the evidence cannot prove.
- Lesson
- Averages Can Lie
- Goal
- Compare center and spread, inspect sampling choices, and write a conclusion that matches the strength of the evidence.
How a lesson works
A 10-minute reading
This example lesson comes from the unit on distributions, samples, and uncertainty. It moves from “The same average can describe different worlds” to “A sample is a window, not the whole landscape” and builds to one idea: statistics is not the art of making a number look certain; it is the discipline of showing how certain the evidence can be.
Help inside the reading
If a graph seems to contradict the conclusion, our Always-On Mentor can help your child check the sample, calculation, and what the data can support. Your child can also highlight any line of “Averages Can Lie” to ask about it or ask for a visual, and the mentor offers help on its own when they seem stuck.
A check halfway through
Your child answers “Why should a data report describe how a sample was collected?” before reading on, and the Reading Check at the end asks new questions.
A project your child hands in
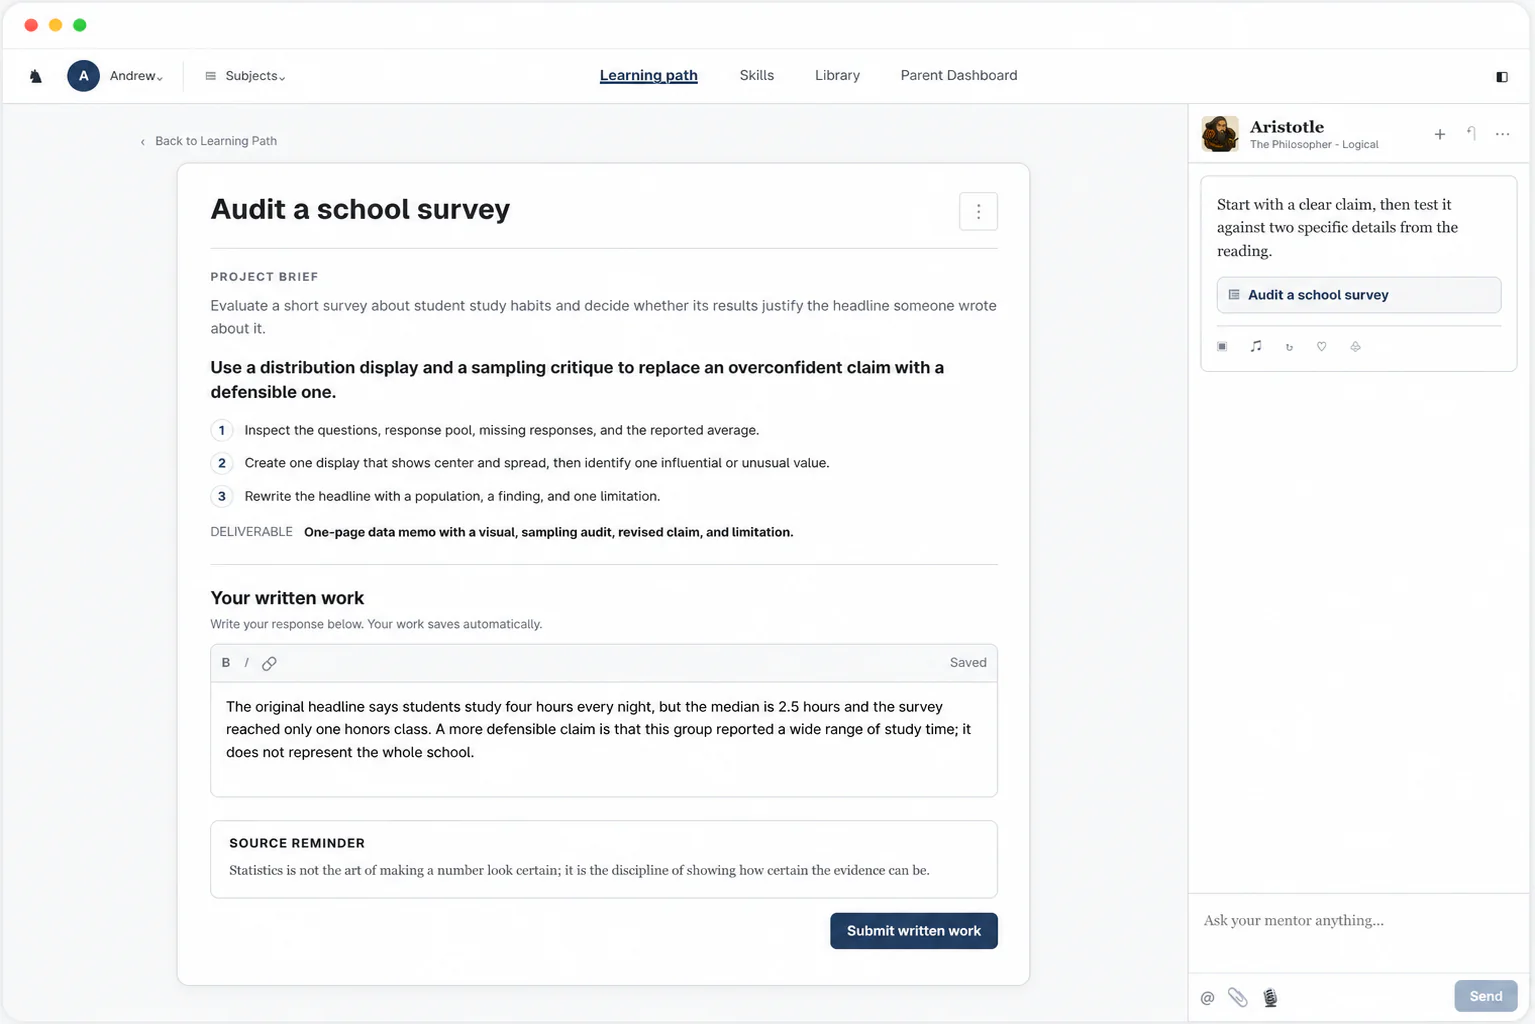
Evaluate a short survey about student study habits and decide whether its results justify the headline someone wrote about it.
- Task
- Use a distribution display and a sampling critique to replace an overconfident claim with a defensible one
- Hand in
- One-page data memo with a visual, sampling audit, revised claim, and limitation
Your parent dashboard
- Today
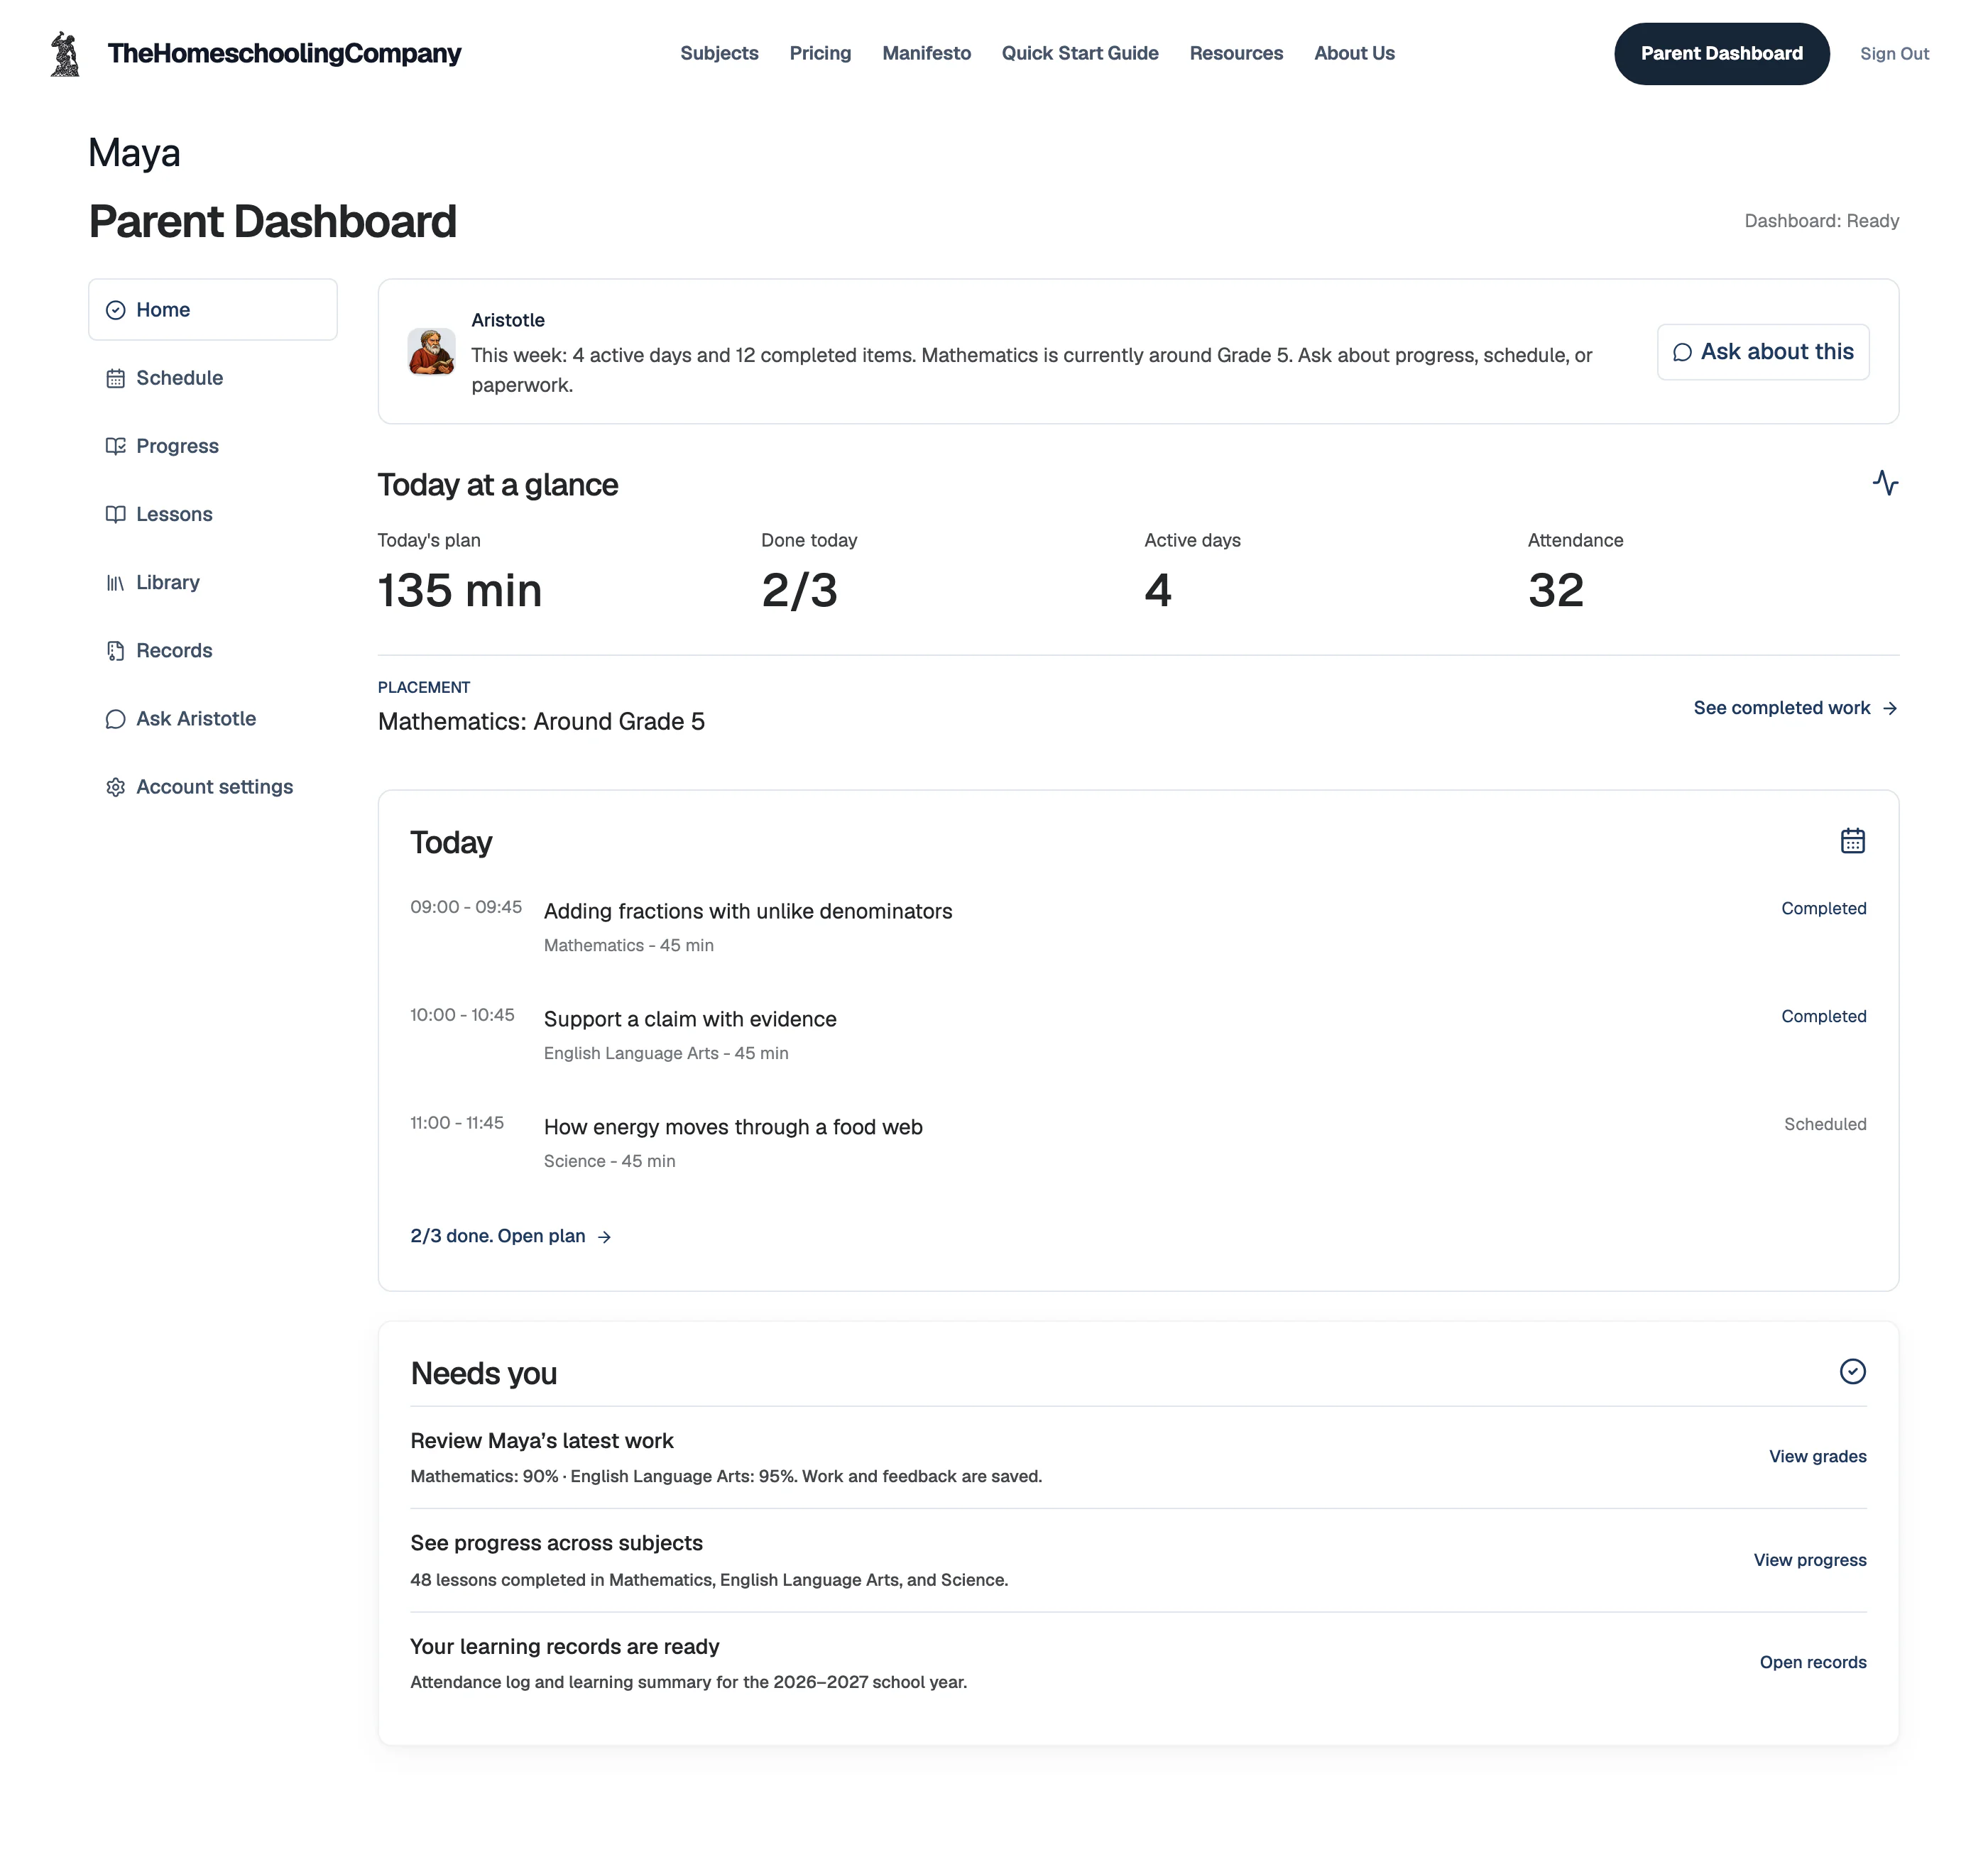
- Each subject's lesson, and whether it's done
- Grades
- Every submission graded instantly, with written feedback, so you never grade
- Records
- Attendance log and learning summary, ready to export
Units and skills by grade
Grades 3 to 5 each have their own statistics units. From grade 6 through grade 12, statistics is one full course: the same 6 units at every grade. Each grade adds a few skills of its own, and your child's grade sets how deep each unit goes.
Grade 33 units · 9 skills
Scaled bar graphs, line plots with fractions, area and perimeter data3 skills
- Scaled Bar Graphs
- Line Plots with Fractions
- Area and Perimeter Data
Multiplication data problems, survey design, fair and unfair games3 skills
- Multiplication Data Problems
- Survey Design
- Fair and Unfair Games
Describe data patterns, compare graph types, data investigation project3 skills
- Describe Data Patterns
- Compare Graph Types
- Data Investigation Project
Grade 43 units · 9 skills
Line plots with fractions, multi-step graph problems, frequency tables3 skills
- Line Plots with Fractions
- Multi-step Graph Problems
- Frequency Tables
Measurement conversion data, data variability introduction3 skills
- Measurement Conversion Data
- Data Variability Introduction
- Probability Experiments
Represent data with scales, interpret misleading displays, data report project3 skills
- Represent Data with Scales
- Interpret Misleading Displays
- Data Report Project
Grade 53 units · 9 skills
Coordinate data, volume and measurement data, line plot operations3 skills
- Coordinate Data
- Volume and Measurement Data
- Line Plot Operations
Mean as balance point preview, data distributions introduction3 skills
- Mean as Balance Point Preview
- Data Distributions Introduction
- Experimental Probability
Compare two data sets, graph selection, statistics poster project3 skills
- Compare Two Data Sets
- Graph Selection
- Statistics Poster Project
Grades 6 to 126 units · 70 skills
Data displays12 skills
- Read a dot plot
- Read a histogram
- Read a box plot
- Choose a display for categorical data
- Choose a display for quantitative data
- Create a two-way frequency table
- Read a relative frequency table
- Identify misleading scale choices
- Create a dot plot from measurement data
- Analyze association in a scatter plot
- Estimate a trend line from scatter plot data
- Critique a misleading visualization
Center and spread13 skills
- Calculate mean
- Calculate median
- Calculate interquartile range
- Calculate standard deviation from technology output
- Compare distributions using center and spread
- Identify outlier effects on mean
- Use z-score to compare values
- Compare variability across groups
- Use mean absolute deviation
- Compare distributions with standard deviation
- Compare standard deviations
- Use normal distribution z-scores
- Interpret z-score in context
Probability15 skills
- List outcomes in a sample space
- Calculate simple probability
- Calculate compound probability with an and rule
- Calculate compound probability with an or rule
- Use conditional probability from a two-way table
- Use a tree diagram
- Use a normal model probability
- Calculate expected value
- Use experimental probability
- Use experimental probability from trial data
- Use two-way tables for relative frequency
- Use conditional probability notation
- Calculate conditional probability from a table
- Use binomial probability in context
- Use expected value in a decision
Sampling11 skills
- Distinguish sample from population
- Identify selection bias
- Identify response bias
- Explain random assignment
- Explain random sampling
- Identify placebo effect
- Distinguish observational study from experiment
- Identify confounding variables
- Use random sampling to compare populations
- Identify representative sampling methods
- Identify confounding in an experiment
Inference12 skills
- Interpret margin of error
- Interpret a confidence interval
- Use simulation to estimate a probability
- Recognize statistical significance from intervals
- Interpret p-value informally
- State a null hypothesis
- Use a confidence interval to compare groups
- Use simulation to test a claim
- Construct and interpret a confidence interval for a proportion
- Check conditions for a one-proportion interval
- Perform a significance test for a proportion informally
- Perform an informal significance test
Regression and advanced inference7 skills
- Interpret slope in a regression equation
- Use residuals to judge model fit
- Identify leverage in a scatter plot
- Choose an inference procedure from a study design
- Interpret residual sign
- Identify extrapolation in a regression prediction
- Choose between linear and nonlinear models from residuals
Questions parents ask
Which grades can use this Statistics curriculum?
- Grades 3 to 12. The skill trees on this page show the units and skills by grade. Placement checks your child's current skills, so the first lesson can sit before or after their grade.
What should my child know before starting?
- Starting skills include basic arithmetic proficiency, familiarity with percentages and fractions, and basic graphing knowledge. If placement finds a gap, the course starts with those skills.
How much of the teaching do I do?
- None of it. The course explains each new idea and checks how your child uses it, while the mentor answers questions as they work. Every submission is graded as soon as it comes in, so you never grade it yourself.
Can I use the record for high-school planning?
- Yes. The subject record holds every graded assignment with its written feedback, ready to export. We generate a transcript from the course records, ready for you to sign.
Statistics, taught around your child
Data judgment that holds up outside a worksheet.
$49/month after the trial.